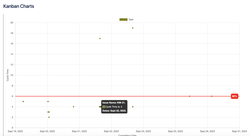
 The team were already using a kanban board/system. They were not sure how to measure productivity. People were leaving the team often. They were considering a new tool $$$ that promised to solve the issues. Team type: Admin Work: processing permission requests Initial conversation: The team were already using a kanban board/system. They were not sure how to measure productivity. People were leaving the team often. They were considering a new tool $$$ that promised to solve the issues. Clean up stage: We walked through their kanban board to define when work starts, when it ends and how the transition between different stages happens. We then walked through their work in progress to clean up any items or change their statuses to reflect reality. Metrics discussion: We agreed how to measure cycle time for work items and how to visualise it. We implemented displaying work item age on the Kanban board for every item and using Scatter plots to see cycle distribution and be able to investigate specific items. Data gathering and chart generation: With the help of the Work Item Age app it was easy to configure it and start tracking the work item age. Within a couple of weeks we had sufficient data to produce a scatter plot using the Kanban charts app. Analysis: As per the screenshot attached, there was some work items completed for around the same number of days and then some outliers. We looked at the longest cycle times and after speaking to the relevant worker we discovered that the property owners were not responsive and despite multiple calls the requests couldn’t be progressed. Then we looked at the lowest cycle time and noticed that most of them belonged to Megan. It turned out Megan had a different strategy. Instead of processing the easy requests while leaving the more difficult to wait another day, she would focus on closing all requests as soon as possible. Megan found inventive ways to get through to the owners of the properties who were not responsive, something nobody else was trying to do. Follow up actions Having seen these results, Katy already knew what she had to do and my job was almost done. She asked Megan to train the rest of the team to follow her example of unblocking non-responsive owners. Katy realised that displaying the work item age for every permission request allows her to quickly identify the ones that are getting “too old” and need immediate attention. And last but not least Katy figured out that the cycle time is the perfect metric for her team’s productivity that she was looking for and in combination with work item age monitoring and the scatter plot of cycle times, she didn’t need to buy a new expensive tool anymore. As a bonus, the people on her team seemed happier because work was less frustrating and they were able to get more permission requests completed. Summary of results 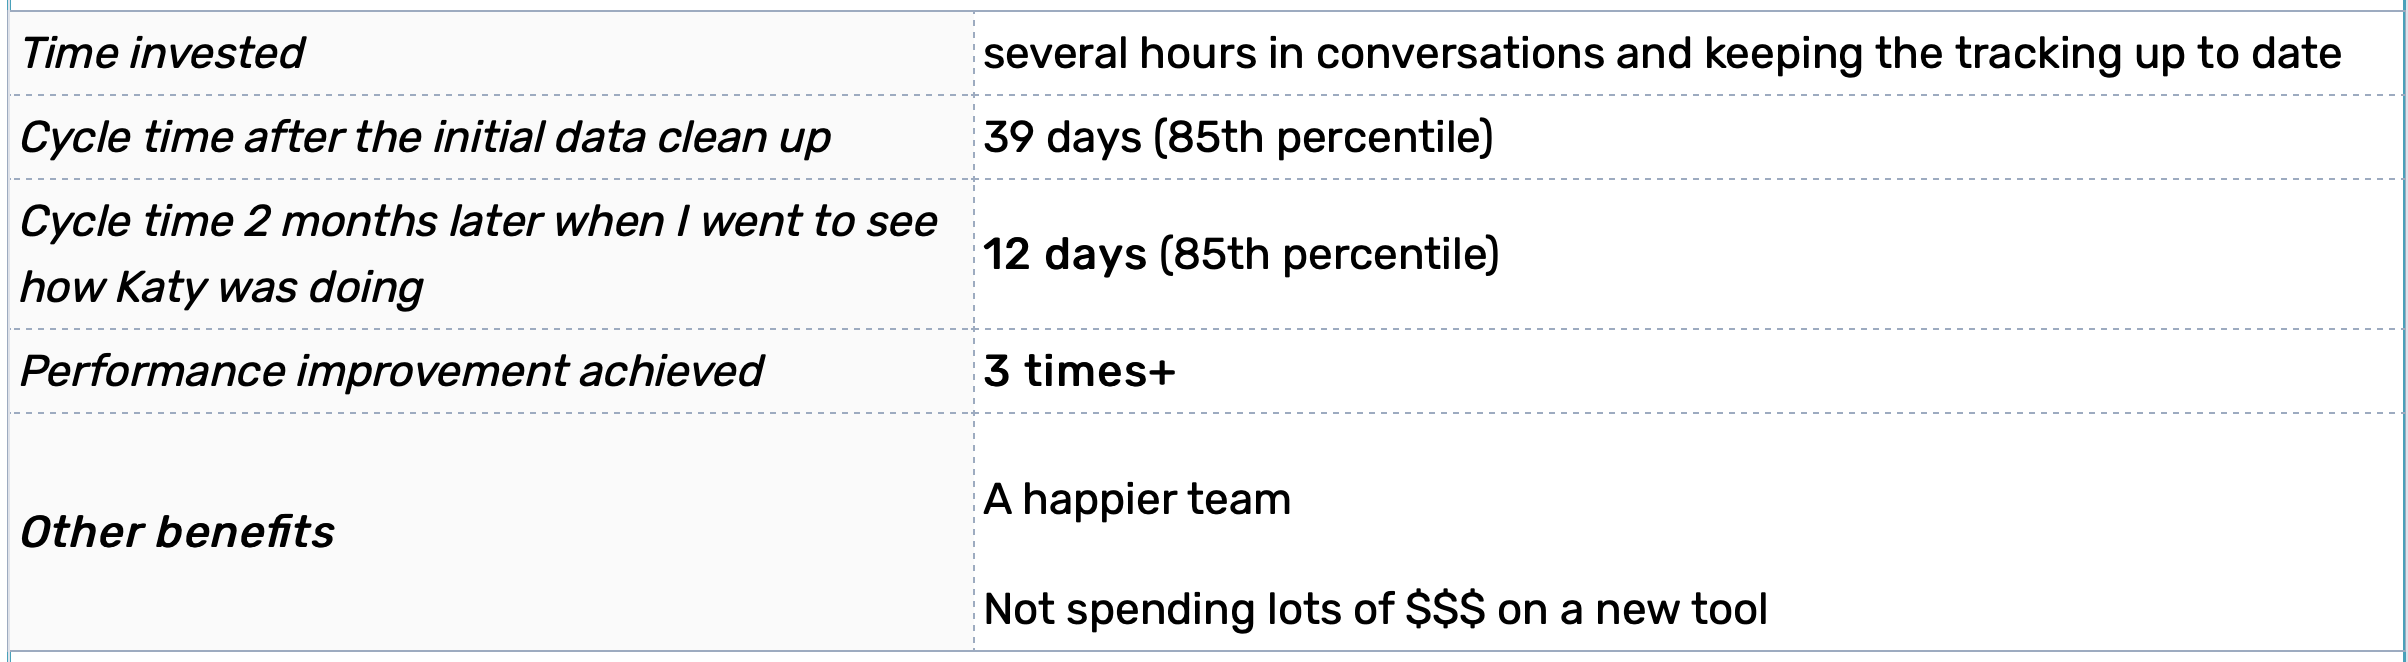 Time invested: Several hours in conversations and keeping the tracking up to date
Cycle time after the initial data clean up: 39 days (85th percentile) Cycle time 2 months later when I went to see how Katy was doing: 12 days (85th percentile) Performance improvement achieved: 3 times+ Other benefits: A happier team Not spending lots of $$$ on a new tool |
Welcome to our blog!About the authorPlamen is a LeanStack coach and an experienced Software Delivery consultant helping organisations around the world identify their path to success and follow it. Archives
May 2024
Categories
All
|
 RSS Feed
